![]()
eKon 101
Submitted by Atlas Indicators Investment Advisors on January 31st, 2026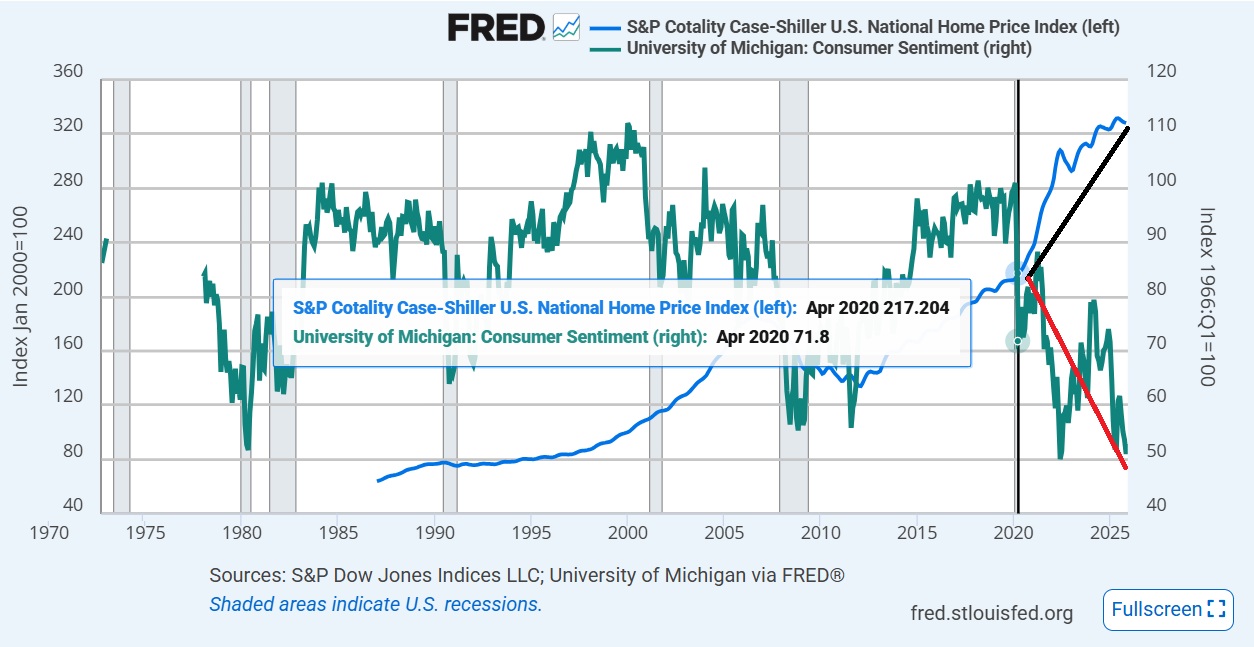
Atlas has been noticing recently what is called the K-shape of the American economy. In short, a portion of the economy, and a relatively small segment at that, has fared relatively well while a larger ratio of the population seems to be having a different experience. For those benefiting from the rising prices of assets, things are more likely to feel good while that is less so for other Americans who seem to feel they are being left behind. The two diverging charts above demonstrate how this differentiated experience is evolving within our nation.
The upward sloping arm of the “K” above is the trajectory of housing prices represented generically by the Case-Shiller U.S. National Home Price Index.
The downward sloping arm represents Consumer Sentiment from the University of Michigan (UofM). Generally speaking, Americans are feeling less and less sanguine despite asset prices (e.g., stocks, houses, and precious metals) rising. Even though January’s UofM Sentiment survey was slightly higher for a second consecutive month, its tally remained roughly 26% below its level coming out of the Covid-19 era recession. Why? Respondents cited pressure on purchasing power and concerns about a softening labor market.
Juxtaposed with the nearly relentless increase in asset prices recently, the sentiment survey tells a story being missed by those with rising net worths and faith in the future. The lower arm is being drawn by those feeling the pinch of rising prices even as the pace of inflation moderates. Their cushions are thinner and possibly thinning further. Meanwhile, many leaders in Washington D.C. reassure them things are fine. One arm represents the smiles of those prospering while the lower arm might look more like half a frown. The American experience seems to differ dramatically depending on which line one lives.
