Existing Home Sales
- Home
- Existing Home Sales
You are here
January 2019 Existing Home Sales
Submitted by Atlas Indicators Investment Advisors on February 27th, 2019Existing home sales suffered their third consecutive setback. 
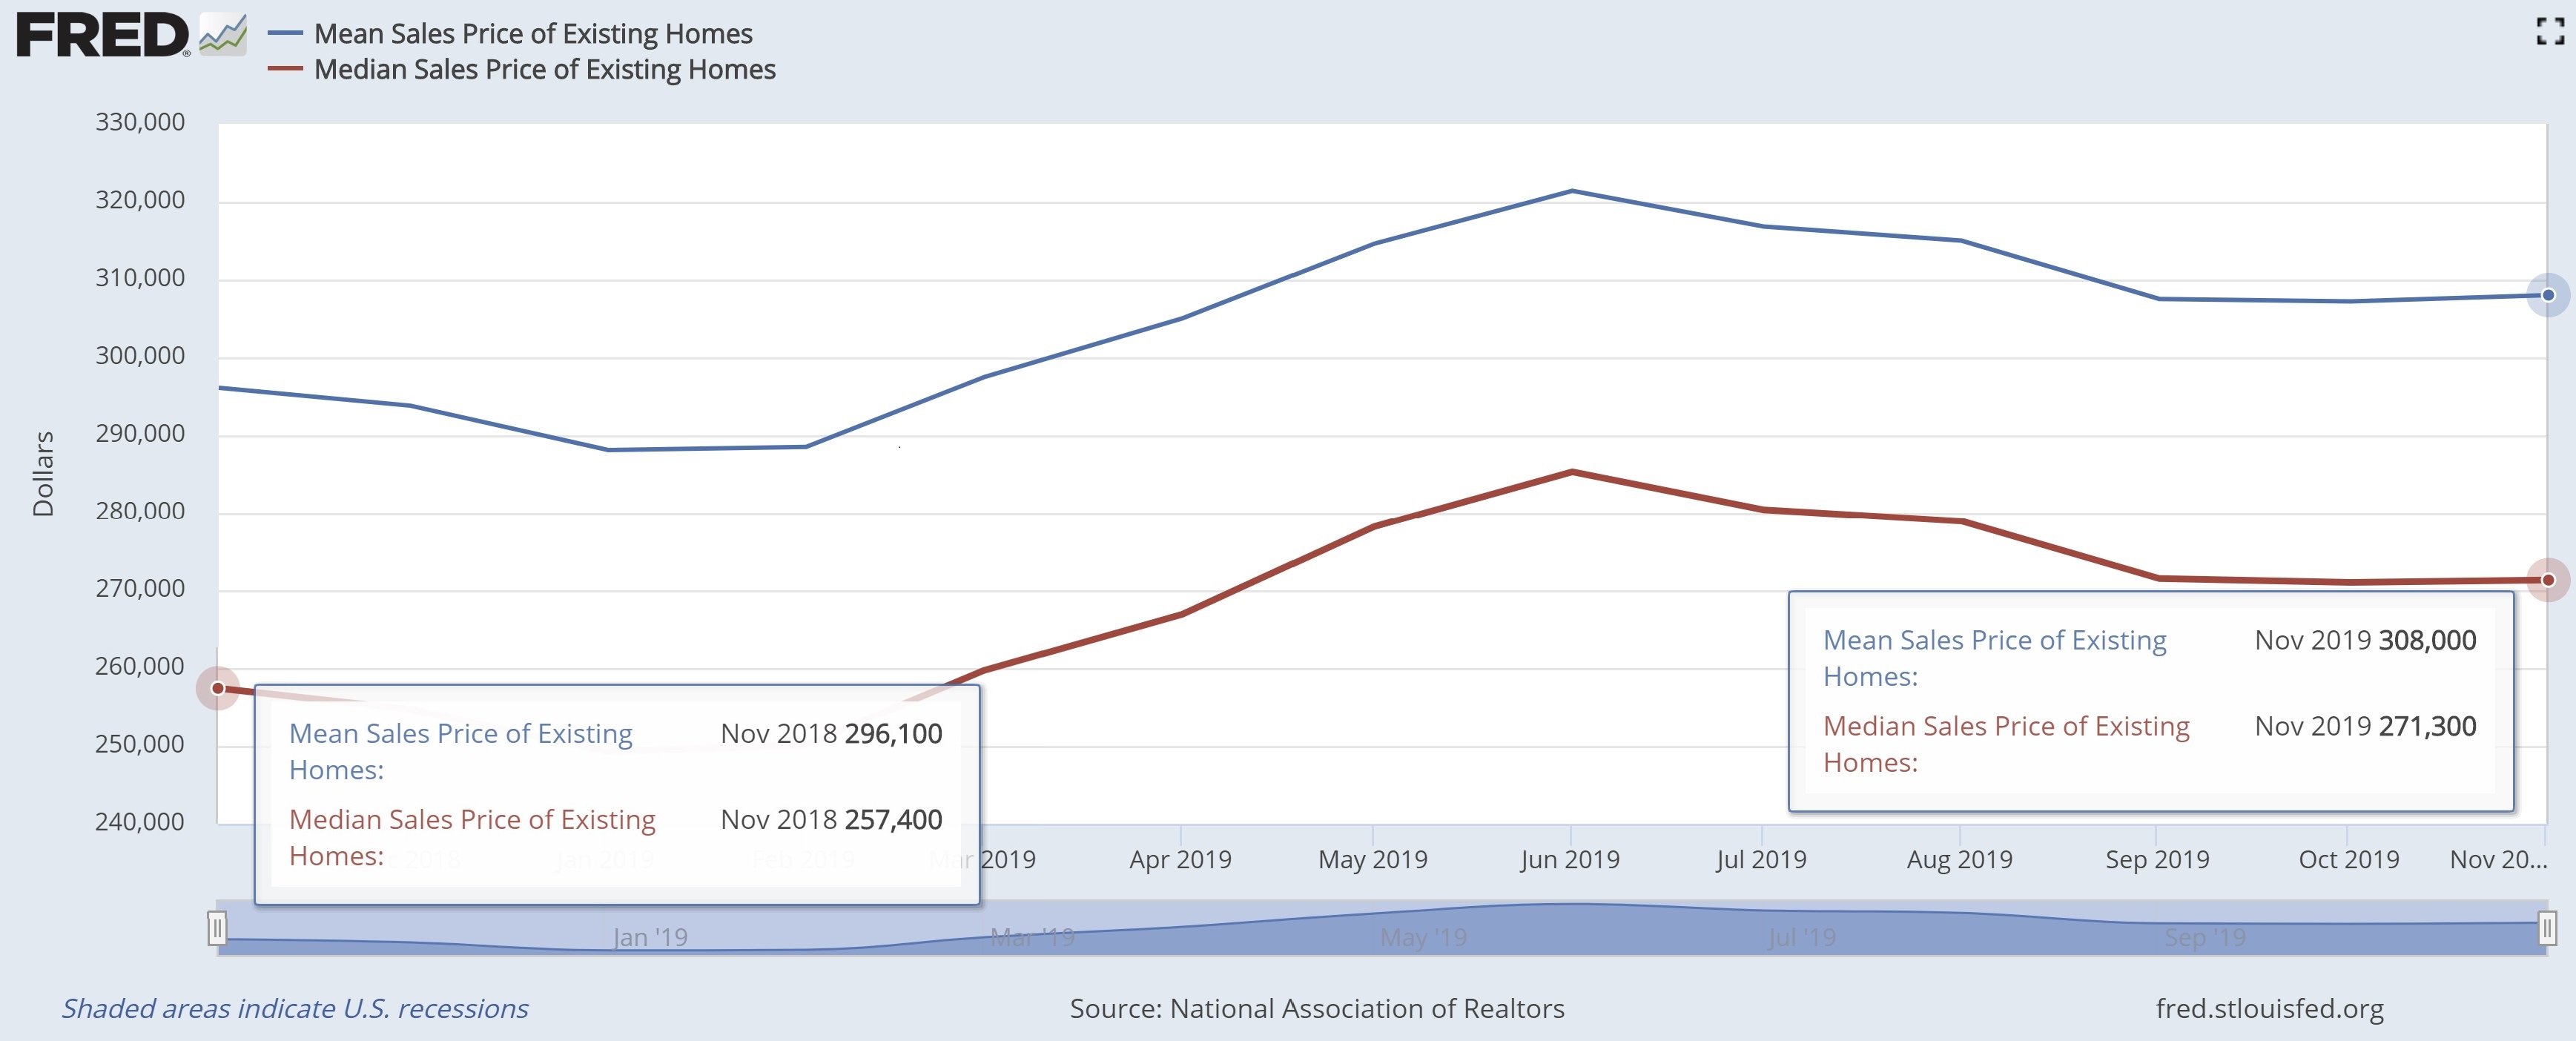
According to the National Association of Realtors (NAR), transactions fell 1.2 percent in January 2019 to 4.94 million units on a seasonally adjusted annualized basis; this is the worst reading since November 2015.
Existing Home Sales July 2018
Submitted by Atlas Indicators Investment Advisors on August 31st, 2018
Existing home sales suffered a decline in July 2018 according to the National Association of Realtors. Dropping 0.7 percent, this housing market indicator has fallen for four consecutive months. July’s tally now posts the slowest transaction pace in over two years.
April 2018 Existing Home Sales
Submitted by Atlas Indicators Investment Advisors on June 6th, 2018
Existing homes sales were disappointing to start the second quarter of 2018 after moving higher in both February and March. Month-over-month, transaction volume fell 2.5 percent in April. Even more disappointing is the year-over-year tally which also fell, dropping 1.4 percent and declining for a second consecutive period.
February 2018 Existing Home Sales
Submitted by Atlas Indicators Investment Advisors on March 31st, 2018
December 2017 Existing Home Sales
Submitted by Atlas Indicators Investment Advisors on January 28th, 2018Existing homes sales declined at the end of 2017 but edged higher for the year, putting in the best annual tally since 2006. Data from the National Association of Realtors (NAR) show sales dropped 3.3 in December to 5.57 million annualized units, a decline from the downwardly revised tally of 5.78 million in November (originally 5.81 million). Despite the revision, November 2017 was
November 2017 Existing Home Sales
Submitted by Atlas Indicators Investment Advisors on December 26th, 2017
Sales of existing homes jumped in November 2017 according to the National Association of Realtors. Accelerating 5.6 percent in the period, sales totaled 5.81 million units on a seasonally adjusted annualized basis. November’s sales pace is the strongest in over a decade. Additionally, October’s tally was upwardly revised to 2.4 percent (originally 2.0 percent).
September 2017 Existing Home Sales
Submitted by Atlas Indicators Investment Advisors on October 24th, 2017
Sales of existing homes moved against the recent declining trend during September 2017, increasing 0.7 percent. Rising to an annualized rate of 5.39 million units, this is the first uptick in four months. While the monthly move was up, the year-over-year tally dropped 1.5 percent which is the first annual decline since July 2016.
August 2017 Existing Home Sales
Submitted by Atlas Indicators Investment Advisors on September 26th, 2017
Transaction volume slowed in the existing homes market during the month of August 2017 according to the National Association of Realtors. Declining 1.7 percent, there were 5.35 million units sold on an annualized basis, down from 5.44 million in July. Compared to a year earlier, transactions gained just 0.2 percent, the slowest pace since August 2016.
August 2017 Existing Home Sales
Submitted by Atlas Indicators Investment Advisors on September 21st, 2017
Transaction volume slowed in the existing homes market during the month of August 2017 according to the National Association of Realtors. Declining 1.7 percent, there were 5.35 million units sold on an annualized basis, down from 5.44 million in July. Compared to a year earlier, transactions gained just 0.2 percent, the slowest pace since August 2016.