
  877.543.5970 ext. 102   christopher@atlasindicators.com
  •  
  •   Client Login

  • Home
  • About 
    • Our Team
    • Our Philosophy
    • Our Process
  • Our Services 
    • Our Services
    • Investments
    • Insurance
    • Retirement Planning
  • Resources 
    • Useful Websites
    • Financial Calculators
    • Video Library
  • Blog
  • Contact

    You are here

  1. Home
  2. Blogs
  3. Ertragskurve

Ertragskurve

Submitted by Atlas Indicators Investment Advisors on February 14th, 2019


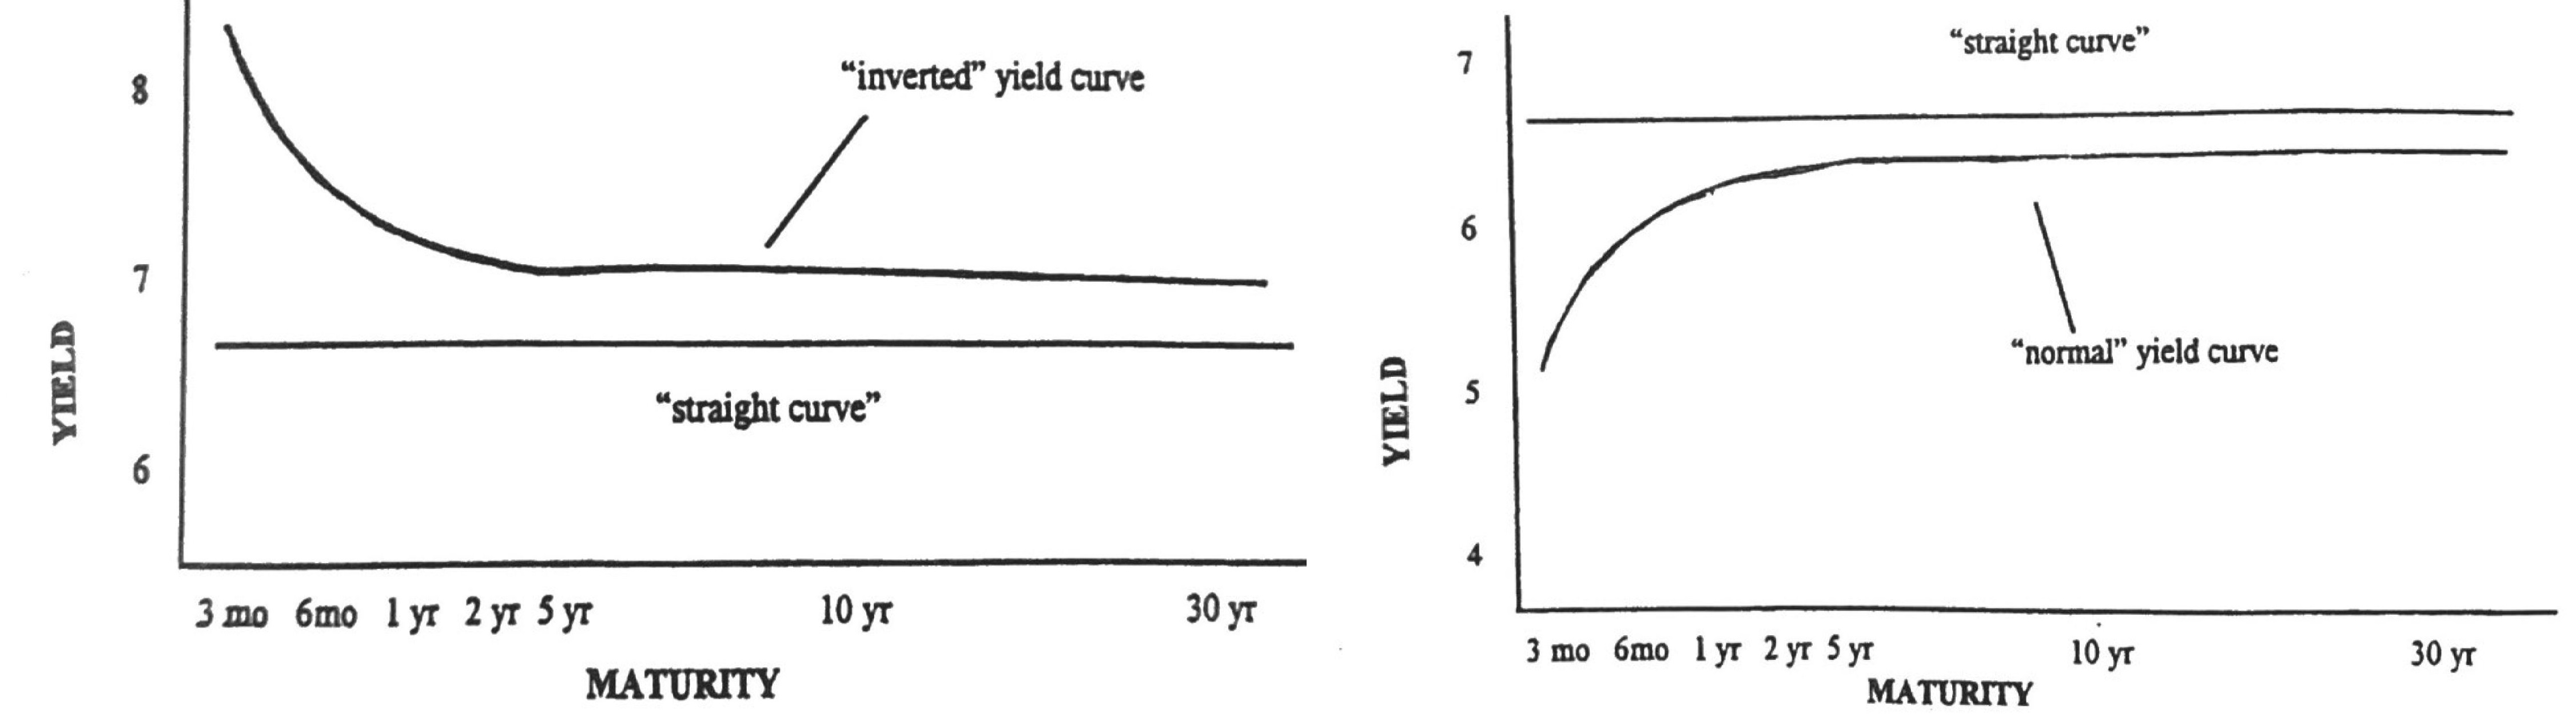
In one of last week’s notes (click here to review), we brought you up to date on America’s trade (im)balance.  In the note, we explained that the deficit fell but did so because America’s exports slowed less than our imports.  We looked at it as a sign of global slowing. Today we’ll explore another sign of global slowing. The German yield curve.


First, we’ll review the yield curve. Simply put, it is a graph showing the relationship between interest rates and time.  The vertical axis represents yield while the horizontal axis is the length of time before a bond’s maturity.  Generally speaking, when these two variables are plotted on the graph, rates are higher the further out their maturities are from today, forming an upward sloping line from the lower left toward the upper right-hand side.  Check out J R’s stylized versions of both positive and negative yield curves above. 


For years, the yield curve in Germany has included segments which were negative (imagine paying your bank to keep money in a savings account).  While many rates were negative last September, the curve’s shape was upward sloping (i.e., a four-year bond would cost you less than one of a shorter maturity).  That all began changing when markets around the globe were hit with a new bout of volatility starting in the late fall of last year.


Even as stock indices here in the U.S. have been behaving more orderly lately, the inverted nature of Germany’s curve has not reversed.  As of this writing, owning short-term debt (e.g., maturing between now and April of next year) costs more to possess than one with a longer expiration (i.e., the curve is once again inverted).


The global economy is probably waning.  We saw it in the trade data and are seeing signs of it in Germany.  China is showing signs of stalling as well (read our note on it here).  These are significant economies and their progress will greatly influence the growth patterns of the world along with America.  We’ll keep an eye on them all and give you our take if things change in material ways.

Tags:
  • Friday
  • Yield Curve

Book a Meeting

Tell a Friend

Looking to learn more?

Get in touch today

Contact Us

Additional info

  • Sitemap
  • Legal, privacy, copyright and trademark information

Contact info

  •   560 W Foothill Pkwy, Corona, CA 92882
  •   877.543.5970 ext. 102
  •   christopher@atlasindicators.com

Investment Advisory Services offered through Independent Advisor Representatives of Cooper McManus, a Registered Investment Adviser Securities offered through Registered Representatives of Cambridge Investment Research, Inc., a broker-dealer, member FINRA/SIPC, to residents of: CA, HI, MA, MT, OR, PA, and TX. Cambridge and Atlas Indicators Investment Advisors, Inc. are not affiliated.​

Cambridge's Form CRS (Client Relationship Summary)

Please see the following for our services disclaimer: Asset Allocation: Diversification seeks to reduce the volatility of a portfolio by investing in a variety of asset classes. Neither asset allocation nor diversification guarantee against market loss or greater or more consistent returns. Asset allocation does not guarantee a profit or protection from losses in a declining market. Precious Metals: Investments in precious metals such as gold involve risk. Investments in precious metals are not suitable to everyone and may involve loss of your entire investment. These investments are subject to sudden price fluctuation, possible insolvency of the trading exchange and potential losses of more than your original investment when using leverage. Real Estate: Specific-sector investing such as real estate can be subject to different and greater risks than more diversified investments. Declines in the value of real estate, economic conditions, property taxes, tax laws, and interest rates all present potential risks to real estate investments. Diversification: Diversification seeks to reduce the volatility of a portfolio by investing in a variety of asset classes. Neither asset allocation nor diversification guarantee against market loss or greater or more consistent returns. Index: An investor cannot invest directly in an index.

This site is published for residents of the United States and is for informational purposes only and does not constitute an offer to sell or a solicitation of an offer to buy any security or product that may be referenced herein. Persons mentioned on this website may only offer services and transact business and/or respond to inquiries in states or jurisdictions in which they have been properly registered or are exempt from registration. Not all products and services referenced on this site are available in every state, jurisdiction or from every person listed.

© 2025 Atlas Indicators Investment Advisors. All rights reserved.

Website Design For Financial Services Professionals