
  877.543.5970 ext. 102   christopher@atlasindicators.com
  •  
  •   Client Login

  • Home
  • About 
    • Our Team
    • Our Philosophy
    • Our Process
  • Our Services 
    • Our Services
    • Investments
    • Insurance
    • Retirement Planning
  • Resources 
    • Useful Websites
    • Financial Calculators
    • Video Library
  • Blog
  • Contact

    You are here

  1. Home
  2. Blogs
  3. September 2017 Producer Price Index

September 2017 Producer Price Index

Submitted by Atlas Indicators Investment Advisors on October 13th, 2017

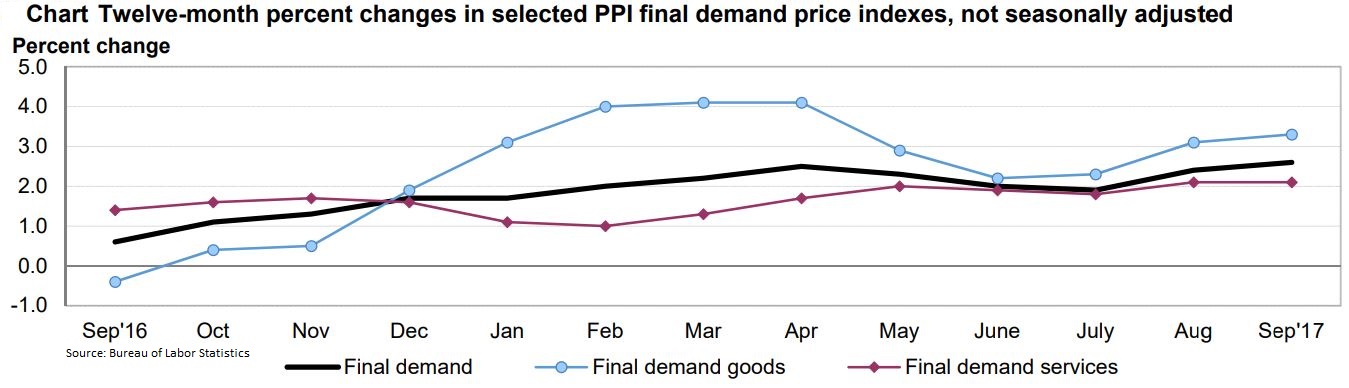
Prices paid by producers and wholesalers continued rising in September 2017 according to the Producer Price Index released by the Bureau of Labor Statistics.  After increasing 0.2 percent in August, this measure of inflation advanced 0.4 percent to end the third quarter.  It has now increased 2.6 percent versus a year ago, the steepest annual increase since February 2012.  Costs associated with both goods and services rose in the period.

Prices for final demand goods rose 0.7 percent, the largest uptick since jumping 1.0 percent in January.  Final demand energy accounted for over 80 percent of September’s surge as it climbed 3.4 percent; disruptions in refining capacity created by Hurricane Harvey probably caused this unusual increase.  Excluding the volatile food and energy components, goods still managed to increase 0.3 percent.  However, the food index was unchanged. 

Services rose 0.4 percent, the largest increase since April of this year when they climbed 0.5 percent.  Growing margins in the trade services created most of the uptick.  Additionally, transportation and warehousing services climbed 1.0 percent.

Earlier stages of output were mixed.  Processed goods for intermediate demand advanced 0.5 percent, the fastest increase since April of this year.  Like the final demand goods category, energy pushed this higher.  Nevertheless, unprocessed goods for intermediate demand moved lower, falling 0.4 percent.  Here we see food and feedstuffs pushing the category down.  Finally, services for intermediate demand rose moderately, increasing 0.1 percent or half the pace of August.

As you can see in the graph above, producer prices are trending higher.  The headline’s year-over-year tally (represented by the black line) is even higher than April when the goods portion (the blue line) was near its recent peak.  Now prices for goods are reaccelerating even as the costs for services continue to pick up the pace.  These movements will likely be part of the interest rate discussion at the next Federal Open Market Committee meeting.

Tags:
  • Federal Reserve

Book a Meeting

Tell a Friend

Looking to learn more?

Get in touch today

Contact Us

Additional info

  • Sitemap
  • Legal, privacy, copyright and trademark information

Contact info

  •   560 W Foothill Pkwy, Corona, CA 92882
  •   877.543.5970 ext. 102
  •   christopher@atlasindicators.com

Investment Advisory Services offered through Independent Advisor Representatives of Cooper McManus, a Registered Investment Adviser Securities offered through Registered Representatives of Cambridge Investment Research, Inc., a broker-dealer, member FINRA/SIPC, to residents of: CA, HI, MA, MT, OR, PA, and TX. Cambridge and Atlas Indicators Investment Advisors, Inc. are not affiliated.​

Cambridge's Form CRS (Client Relationship Summary)

Please see the following for our services disclaimer: Asset Allocation: Diversification seeks to reduce the volatility of a portfolio by investing in a variety of asset classes. Neither asset allocation nor diversification guarantee against market loss or greater or more consistent returns. Asset allocation does not guarantee a profit or protection from losses in a declining market. Precious Metals: Investments in precious metals such as gold involve risk. Investments in precious metals are not suitable to everyone and may involve loss of your entire investment. These investments are subject to sudden price fluctuation, possible insolvency of the trading exchange and potential losses of more than your original investment when using leverage. Real Estate: Specific-sector investing such as real estate can be subject to different and greater risks than more diversified investments. Declines in the value of real estate, economic conditions, property taxes, tax laws, and interest rates all present potential risks to real estate investments. Diversification: Diversification seeks to reduce the volatility of a portfolio by investing in a variety of asset classes. Neither asset allocation nor diversification guarantee against market loss or greater or more consistent returns. Index: An investor cannot invest directly in an index.

This site is published for residents of the United States and is for informational purposes only and does not constitute an offer to sell or a solicitation of an offer to buy any security or product that may be referenced herein. Persons mentioned on this website may only offer services and transact business and/or respond to inquiries in states or jurisdictions in which they have been properly registered or are exempt from registration. Not all products and services referenced on this site are available in every state, jurisdiction or from every person listed.

© 2025 Atlas Indicators Investment Advisors. All rights reserved.

Website Design For Financial Services Professionals