
  877.543.5970 ext. 102   christopher@atlasindicators.com
  •  
  •   Client Login

  • Home
  • About 
    • Our Team
    • Our Philosophy
    • Our Process
  • Our Services 
    • Our Services
    • Investments
    • Insurance
    • Retirement Planning
  • Resources 
    • Useful Websites
    • Financial Calculators
    • Video Library
  • Blog
  • Contact

    You are here

  1. Home
  2. Blogs
  3. December 2018 New Home Sales

December 2018 New Home Sales

Submitted by Atlas Indicators Investment Advisors on March 11th, 2019


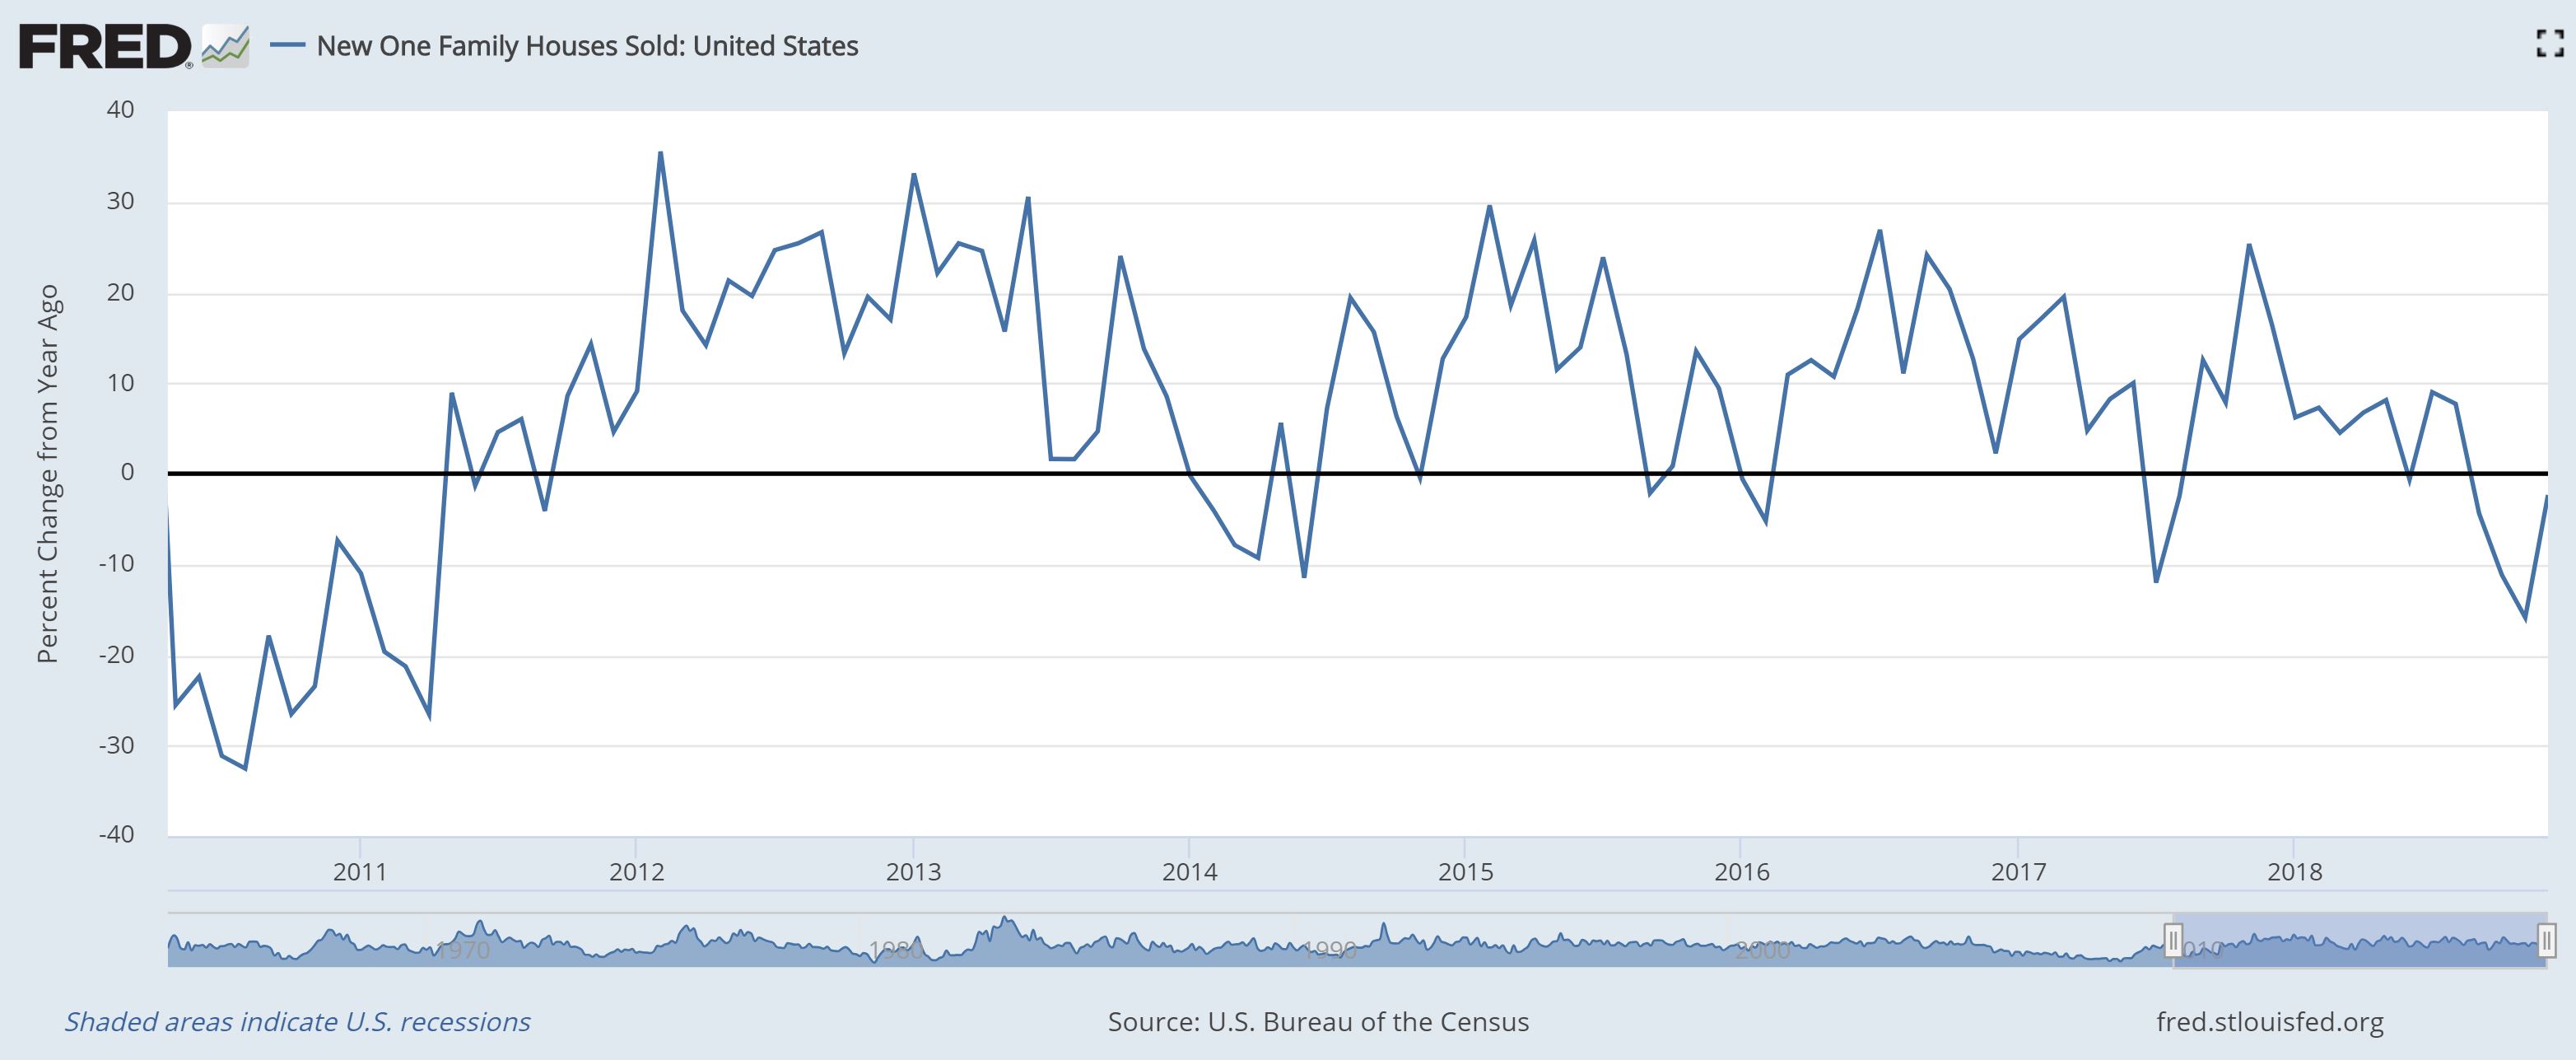
Data for December 2018 New Home Sales were finally tabulated.  Like many indicators produced by the government, the partial shutdown delayed the final 2018 release for this indicator.  On a seasonally adjusted annualized basis, 621,000 units were sold to end the year.  This is an acceleration from November’s downwardly revised count of 599,000 (originally 657,000).  Compared to the same period a year earlier, transactions fell 2.4 percent.


Three of the four regions improved, and one declined.  Winter weather didn’t slow buyers in the Northeast as transactions soared 44.8 percent, putting the year-over-year tally up 16.7 percent.  West sales managed an uptick of 1.4 percent but are still down 23.9 percent from a year earlier.  The largest region (the South) experienced a gain of 5.0 percent and is up 7.4 percent in the past twelve months.  Only the Midwest experienced a monthly decline, falling 15.3 percent, and sales in this portion of the country are off 3.2 percent from a year ago. 


New home inventories climbed.  There were 344,000 units for sales, rising 10,000 versus November.  Of those available, only 71,000 units were completed, so there is a lot of construction expected to come.  This will help push gross domestic product forward in the months ahead.  Based on the pace of current sales, this supply of home would last 6.6 months, declining one-tenth of a month.


Prices proxies were higher.  The median-priced home set the buyer back $318,600, up from $303,500 a month earlier.  An average priced home was $9,400 more expensive, reaching $377,000 to end the year.


This iteration of new home sales helped the year-over-year trend.  Despite being minus 2.4 percent, it’s a big improvement compared to minus 15.9 percent in November (and the worst since April 2011).  As you can see in the chart above, the trend started decelerating in November 2017 and has been negative since September 2018.  This is a weak point in our economy, but we are hopeful that the improving trend will continue in the months ahead and propel the year-over-year tally back above zero.

Tags:
  • Census Bureau
  • GDP
  • New Home Sales

Book a Meeting

Tell a Friend

Looking to learn more?

Get in touch today

Contact Us

Additional info

  • Sitemap
  • Legal, privacy, copyright and trademark information

Contact info

  •   560 W Foothill Pkwy, Corona, CA 92882
  •   877.543.5970 ext. 102
  •   christopher@atlasindicators.com

Investment Advisory Services offered through Independent Advisor Representatives of Cooper McManus, a Registered Investment Adviser Securities offered through Registered Representatives of Cambridge Investment Research, Inc., a broker-dealer, member FINRA/SIPC, to residents of: CA, HI, MA, MT, OR, PA, and TX. Cambridge and Atlas Indicators Investment Advisors, Inc. are not affiliated.​

Cambridge's Form CRS (Client Relationship Summary)

Please see the following for our services disclaimer: Asset Allocation: Diversification seeks to reduce the volatility of a portfolio by investing in a variety of asset classes. Neither asset allocation nor diversification guarantee against market loss or greater or more consistent returns. Asset allocation does not guarantee a profit or protection from losses in a declining market. Precious Metals: Investments in precious metals such as gold involve risk. Investments in precious metals are not suitable to everyone and may involve loss of your entire investment. These investments are subject to sudden price fluctuation, possible insolvency of the trading exchange and potential losses of more than your original investment when using leverage. Real Estate: Specific-sector investing such as real estate can be subject to different and greater risks than more diversified investments. Declines in the value of real estate, economic conditions, property taxes, tax laws, and interest rates all present potential risks to real estate investments. Diversification: Diversification seeks to reduce the volatility of a portfolio by investing in a variety of asset classes. Neither asset allocation nor diversification guarantee against market loss or greater or more consistent returns. Index: An investor cannot invest directly in an index.

This site is published for residents of the United States and is for informational purposes only and does not constitute an offer to sell or a solicitation of an offer to buy any security or product that may be referenced herein. Persons mentioned on this website may only offer services and transact business and/or respond to inquiries in states or jurisdictions in which they have been properly registered or are exempt from registration. Not all products and services referenced on this site are available in every state, jurisdiction or from every person listed.

© 2025 Atlas Indicators Investment Advisors. All rights reserved.

Website Design For Financial Services Professionals