![]()
December 2018 Industrial Production
Submitted by Atlas Indicators Investment Advisors on January 25th, 2019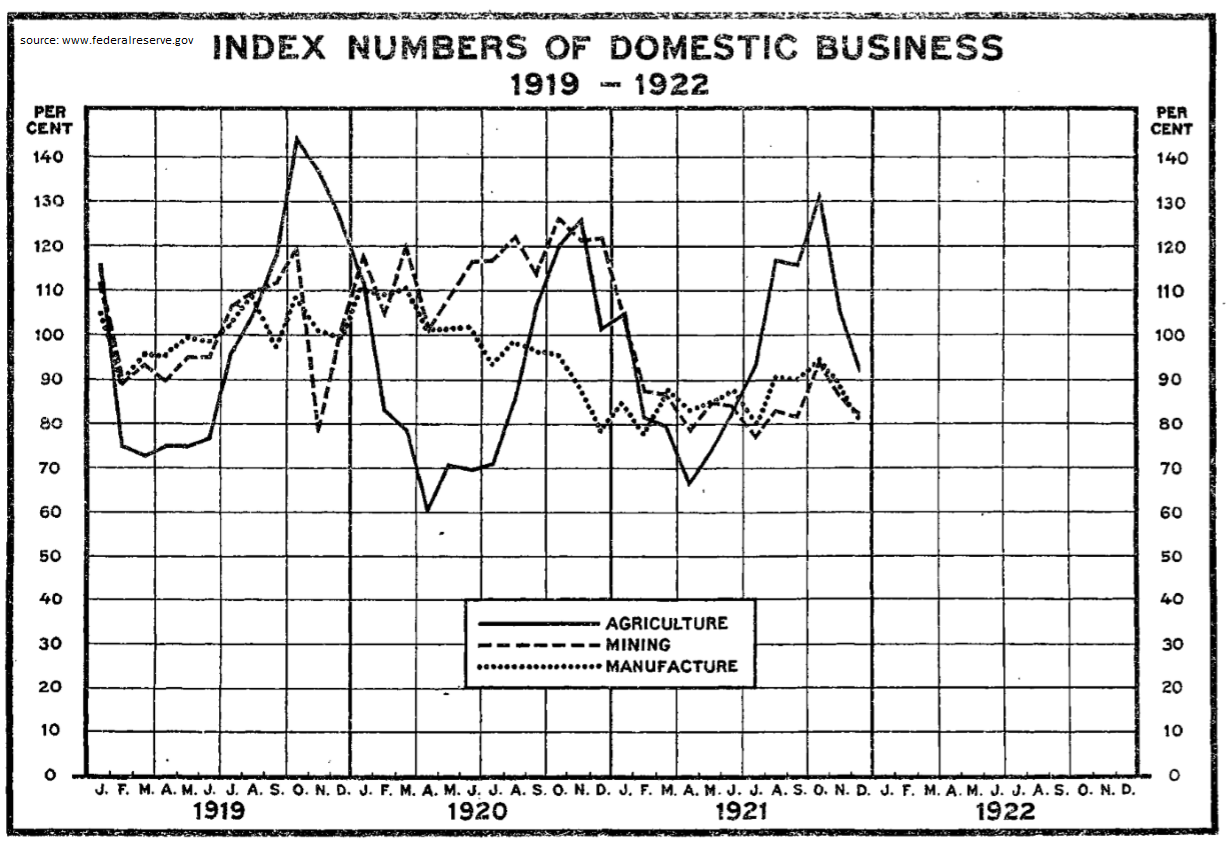
Before we get started on the details of December 2018 Industrial Production, I want to point out that the Federal Reserve’s latest release completes the first 100 years for this indicator. It’s first publication covered data for January 1919. The chart above is a copy of the first chart for industrial production.
Industrial Production finished 2018 with an uptick. This index which covers everything physically produced in America rose 0.3 percent in the period. For the year, industrial output rose an impressive 4.0 percent.
The major industry groups were mixed. Utilities spoiled the fun, plummeting 6.3 percent in the period as warmer-than-normal temperatures lessened the demand for heating. Fortunately, the other two components both rose. Mining output advanced 1.5 percent and was led by gains in oil and gas extraction as well as coal mining. Manufacturing (the largest of the three categories) rose 1.1 percent and managed to increase at a 2.3 percent annualized pace in the fourth quarter of last year; motor vehicle production jumped 4.7 percent and nonmetallic mineral products moved up by nearly three percent.
Capacity utilization is also included in the report. It looks at what percent of the nation’s potential industrial output was used. If it gets too high, it can lead to inflation as firms find it more difficult to keep up with demand, so prices are increased to help maintain equilibrium. Fortunately, America’s industrial capacity is not being challenged. Utilization rose 0.1 percent to 78.7 and is still 1.1 percentage points below the long-run average from 1972-2017.
This was an encouraging release. So many indicators Atlas follows have been decelerating, but this does not seem to be the case for industrial production even after unseasonably warm weather hurt utility output. Atlas marks this indicator in the win column for the U.S. economy.
