
  877.543.5970 ext. 102   christopher@atlasindicators.com
  •  
  •   Client Login

  • Home
  • About 
    • Our Team
    • Our Philosophy
    • Our Process
  • Our Services 
    • Our Services
    • Investments
    • Insurance
    • Retirement Planning
  • Resources 
    • Useful Websites
    • Financial Calculators
    • Video Library
  • Blog
  • Contact

    You are here

  1. Home
  2. Blogs
  3. Curve Brawl

Curve Brawl

Submitted by Atlas Indicators Investment Advisors on June 3rd, 2019

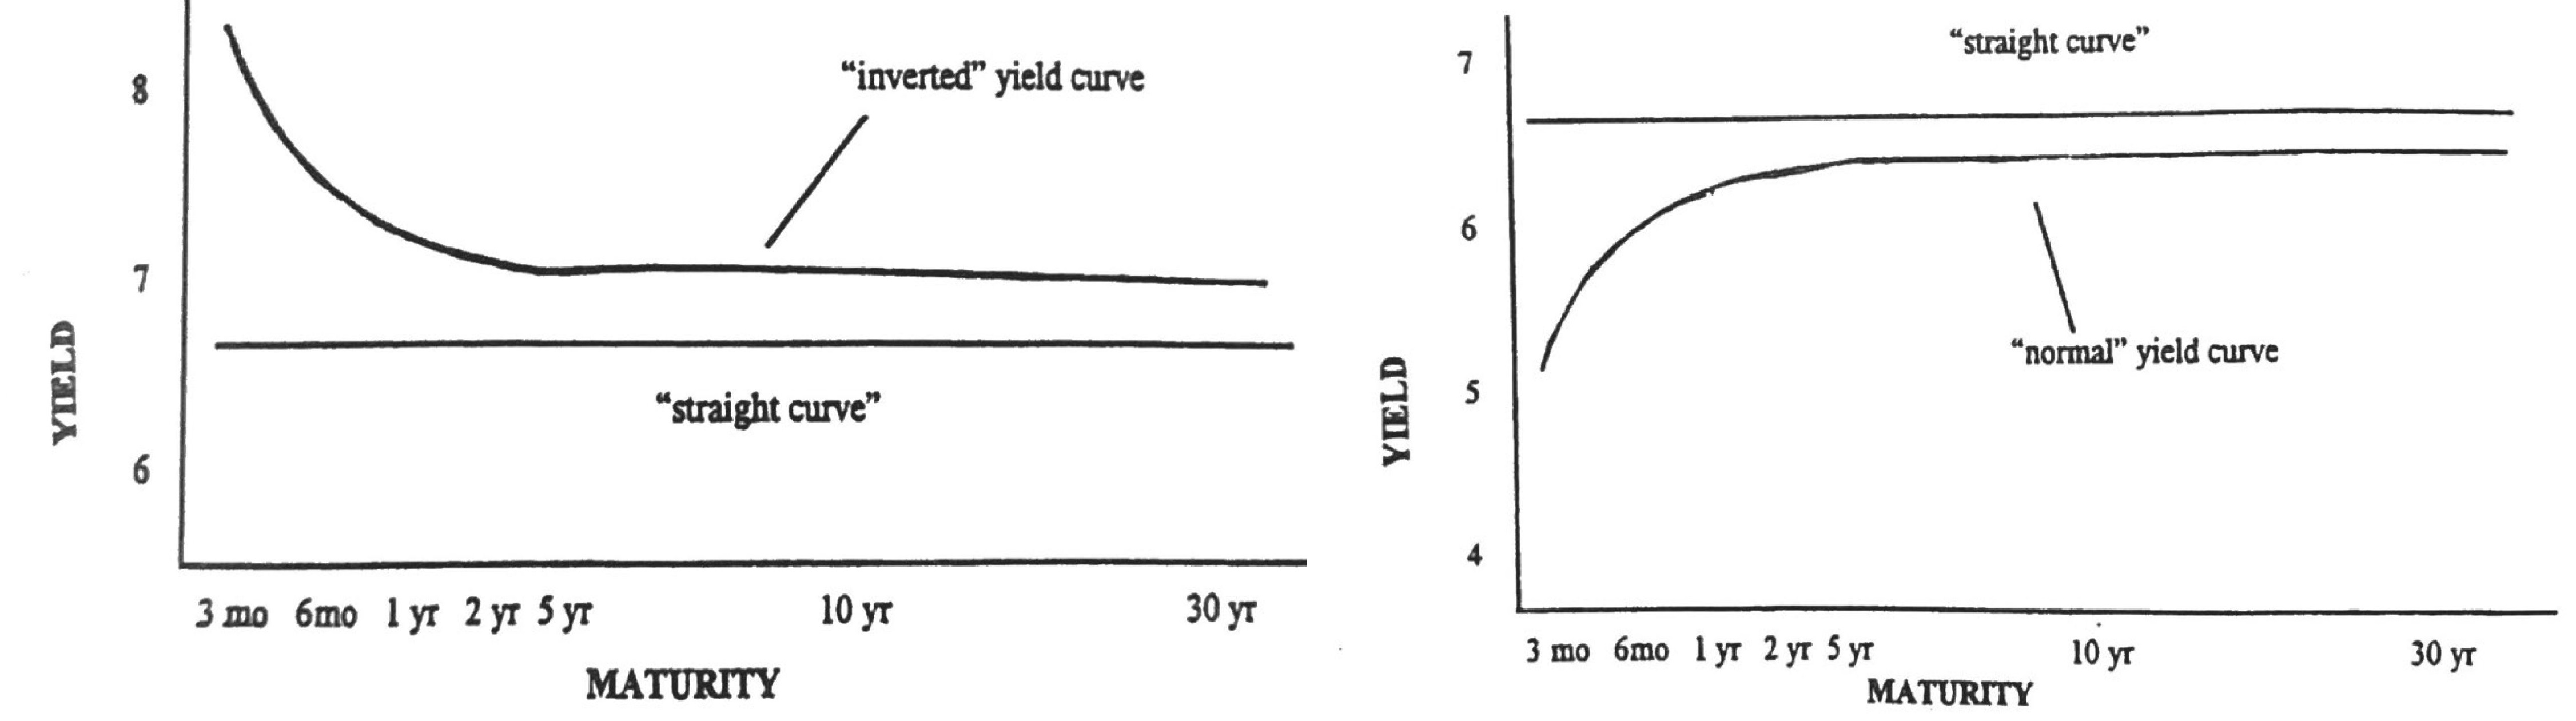
At last Tuesday's Pie Party much of the discussion centered around the U. S, Treasury yield curve, a popular tool sometimes used to forecast recessions using the relationship between yields of various maturities.  For example, if a shorter-term piece of paper like the two-year Treasury note is yielding more than the Treasury's 10-year bond, some would suggest recessionary pressures are building; if the 10-year yield is higher, then the curve is viewed as "normal."

Charting the yield curve itself is fairly straightforward: after drawing a time-line on the horizontal axis of a chart ranging (typically) from three months out to 30 years, plot the yield for each selected maturity on the vertical axis.  Connect the dots and see if the line climbs over time (normal) or vice-versa (inverted).

Oh, if it were only that simple!  Today's financial press is in a big slap-down brawl in an attempt to define what the correct yield curve should encompass.  Atlas has traditionally seen it as a comparison of the two-year versus 10-year yield.  Currently that measure is still (barely) normal.   But more voices are now proclaiming that the "new normal" should look at the 3-month versus 10-year curve which is now a bit negative.  Interestingly, the gentleman credited with conceiving the concept itself several decades ago has recently said the 3-month yield relative to that of the 5-year note has the best predictive value, and it is decidedly negative.

So what is an investor to think?  Choosing any time frame to fit your preferred narrative may be more a solipsist’s convenience than any form of hard science.  But then again, economics is not a field with definite and provable answers like pure math.  Atlas finds we serve you best when sticking to our knitting, employing our own proprietary algorithms, and ignoring all the tea-readers.  Regardless who ends up with the best forecast (this round), we feel confident in our ability to manage market risk in any of the likely scenarios manifesting in the months and years to follow. (by J R Capps)

Tags:
  • J R
  • Pie Party
  • Yield Curve

Book a Meeting

Tell a Friend

Looking to learn more?

Get in touch today

Contact Us

Additional info

  • Sitemap
  • Legal, privacy, copyright and trademark information

Contact info

  •   560 W Foothill Pkwy, Corona, CA 92882
  •   877.543.5970 ext. 102
  •   christopher@atlasindicators.com

Investment Advisory Services offered through Independent Advisor Representatives of Cooper McManus, a Registered Investment Adviser Securities offered through Registered Representatives of Cambridge Investment Research, Inc., a broker-dealer, member FINRA/SIPC, to residents of: CA, HI, MA, MT, OR, PA, and TX. Cambridge and Atlas Indicators Investment Advisors, Inc. are not affiliated.​

Cambridge's Form CRS (Client Relationship Summary)

Please see the following for our services disclaimer: Asset Allocation: Diversification seeks to reduce the volatility of a portfolio by investing in a variety of asset classes. Neither asset allocation nor diversification guarantee against market loss or greater or more consistent returns. Asset allocation does not guarantee a profit or protection from losses in a declining market. Precious Metals: Investments in precious metals such as gold involve risk. Investments in precious metals are not suitable to everyone and may involve loss of your entire investment. These investments are subject to sudden price fluctuation, possible insolvency of the trading exchange and potential losses of more than your original investment when using leverage. Real Estate: Specific-sector investing such as real estate can be subject to different and greater risks than more diversified investments. Declines in the value of real estate, economic conditions, property taxes, tax laws, and interest rates all present potential risks to real estate investments. Diversification: Diversification seeks to reduce the volatility of a portfolio by investing in a variety of asset classes. Neither asset allocation nor diversification guarantee against market loss or greater or more consistent returns. Index: An investor cannot invest directly in an index.

This site is published for residents of the United States and is for informational purposes only and does not constitute an offer to sell or a solicitation of an offer to buy any security or product that may be referenced herein. Persons mentioned on this website may only offer services and transact business and/or respond to inquiries in states or jurisdictions in which they have been properly registered or are exempt from registration. Not all products and services referenced on this site are available in every state, jurisdiction or from every person listed.

© 2025 Atlas Indicators Investment Advisors. All rights reserved.

Website Design For Financial Services Professionals