![]()
October 2019 Income and Outlays
Submitted by Atlas Indicators Investment Advisors on December 12th, 2019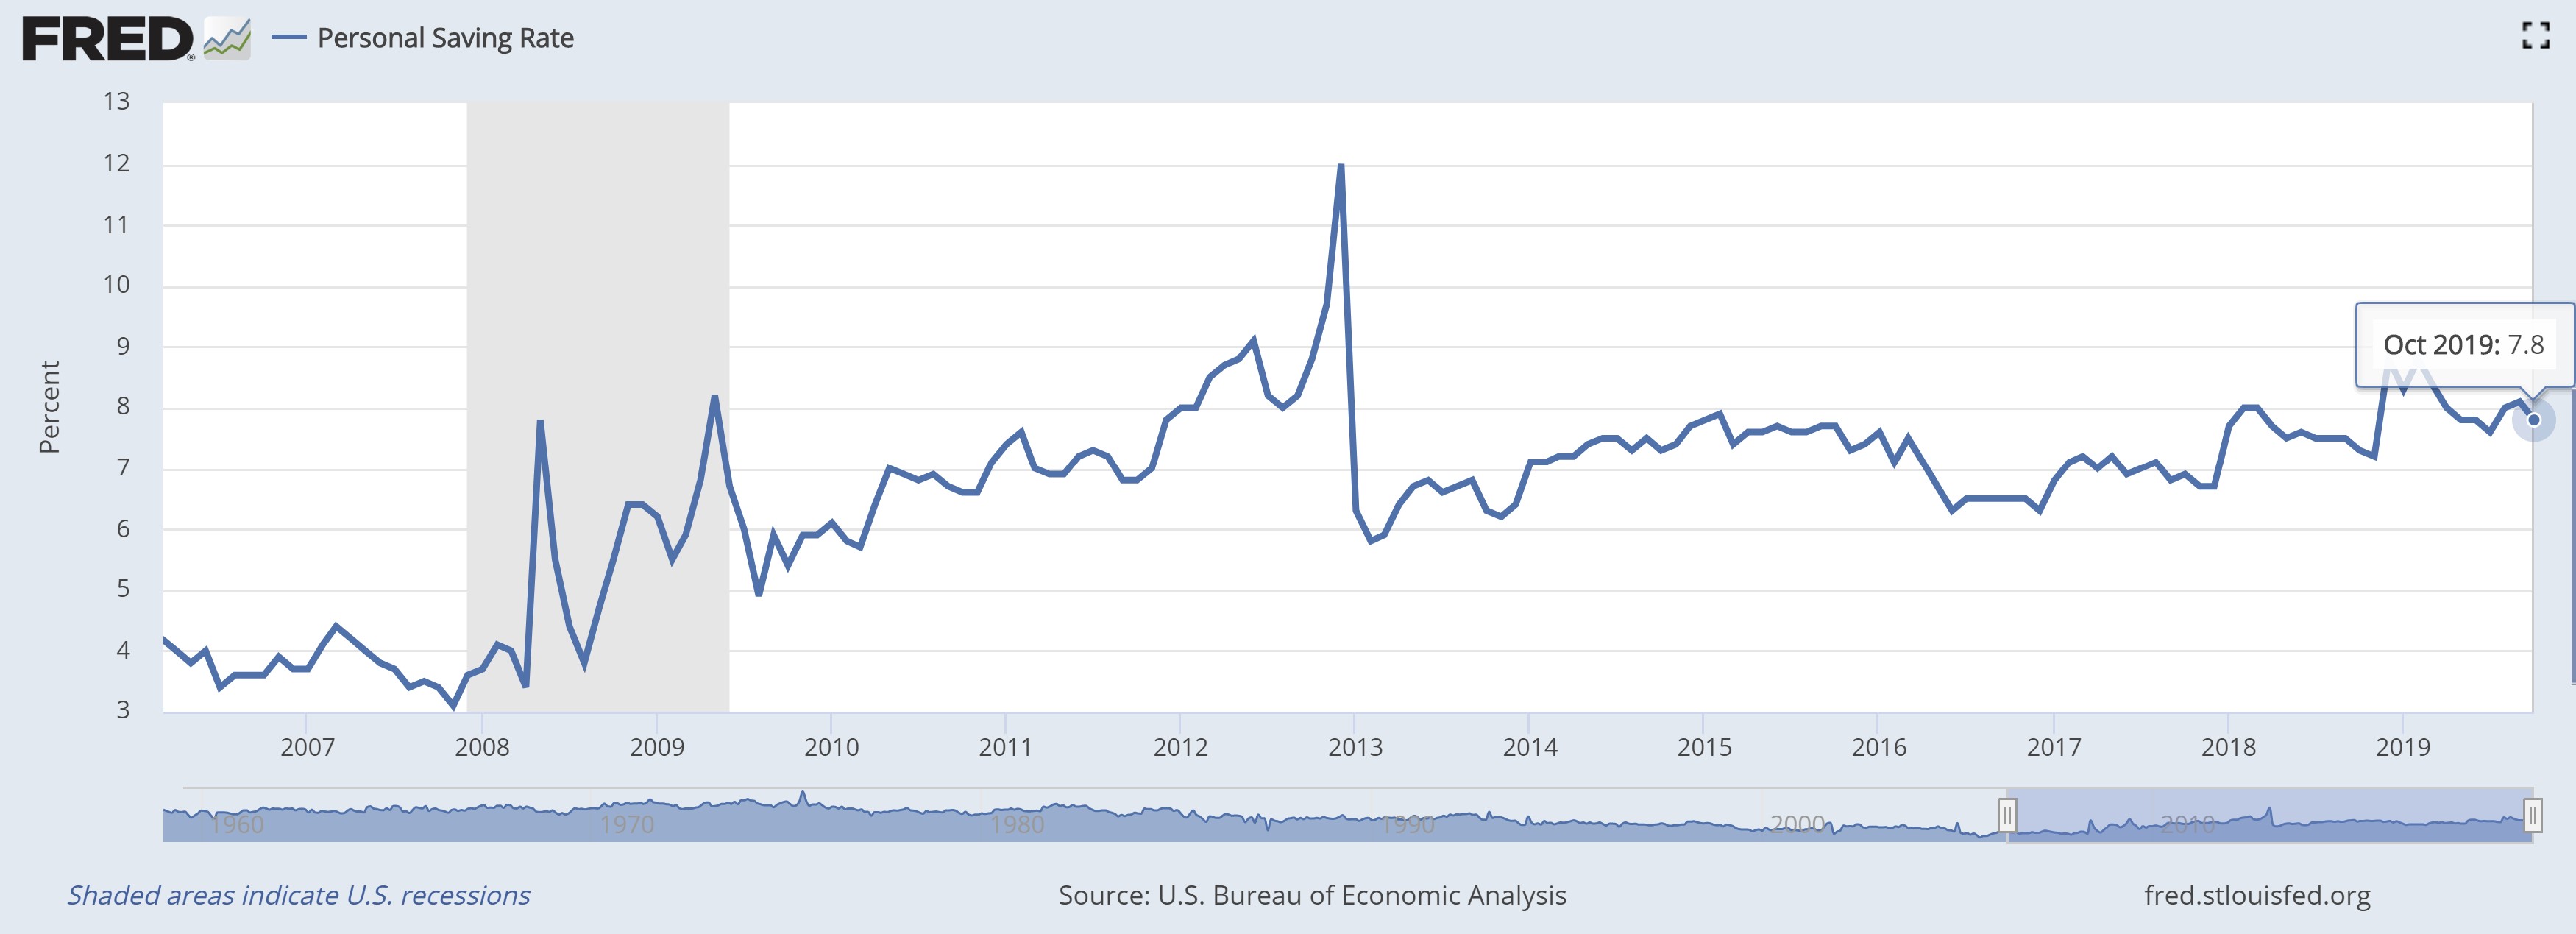
America’s economy thrives on consumption. No indicator tells us more about consumers than the Income and Outlays figures from the Bureau of Economic Analysis. This release covers changes in aggregate pay and spending as well as providing important data on inflation.
Real disposable personal income fell in October 2019. This measure of pay adjusts for inflation and taxes, providing a tally of the money Americans can spend. It declined 0.3 percent, giving up virtually all of the prior period’s gain.
Despite the income setback, Americans spent more. Outlays increased 0.3 percent, outpacing the prior period’s uptick of 0.2 percent. Year-over-year, consumer outlays are up 2.3 percent.
As you might have guessed, the savings rate deteriorated. Anytime spending growth outpaces income growth, savings is diminished. The rate of savings fell to 7.8 percent from 8.1 percent in September. As you can see in the graph above, this is not an awful pace of savings compared to recent history.
The other important figures within this release tell us about pricing changes. The personal consumption expenditure (PCE) price index rose 0.2 percent in the period, accelerating slightly after an unchanged count a month earlier. Year-over-year it is up just 1.3 percent. However, if food and energy are removed (they have been falling in price), the core-PCE price index was marginally lower, but the year-over-year count is up 1.6 percent. This is the Federal Reserve’s preferred price proxy, and it is meaningfully lower than their explicit 2.0 percent target. A trend this far from their stated goal will likely give them the justification to remain quite accommodative for the foreseeable future.
Here’s another indicator suggesting the economy is in good, but not great, shape. Spending is moving ahead even as pay declined. In aggregate, consumers feel comfortable enough in their near-term prospects to shrug off October’s income setback.
