![]()
October 2017 Chicago Fed National Activity Index
Submitted by Atlas Indicators Investment Advisors on November 28th, 2017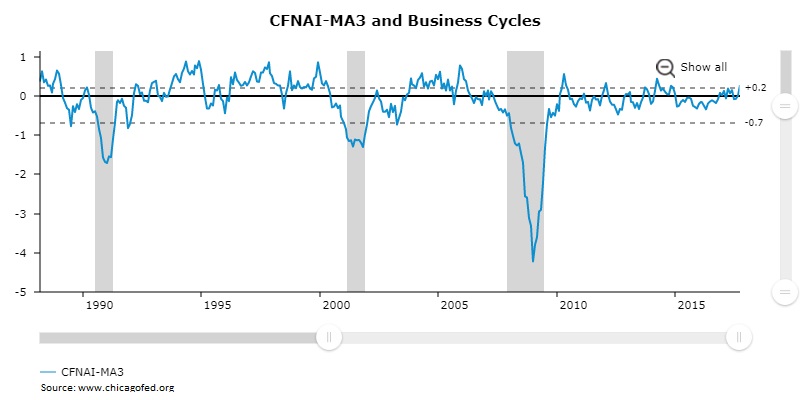
Economic activity continued advancing in October 2017 according to the Chicago Fed National Activity Index (CFNAI). This indicator, which represents a comprehensive look at the economy, increased to +0.65 after an upwardly revised advance of +0.36 in September (originally 0.17). For some context, October’s reading is the highest level of the current expansion! Additionally, this indicator’s three-month moving average jumped to +0.28, the best level since May 2014, from just +0.01 a month earlier.
Data beneath the headline were mixed as only one of the four categories accelerated. Production-related indicators helped the most as the final quarter of the year got underway, rising to +0.53 from +0.18 in September. While still positive, the sales, orders and inventories category decelerated to +0.05 from +0.08. Employment slowed as well, falling to +0.11 from +0.13. Finally, personal consumption and housing indicators deteriorated, falling to -0.04 from -0.02; it is worth noting that while consumption indicators pushed this final category into negative territory, the housing data (both starts and permits) rose in the period.
Eighty-five individual components comprise this comprehensive indicator. Fifty-six of the 85 were positive in October, and the other 29 were negative. Forty-three components improved versus September, while 42 deteriorated. Of the improving indicators, seven still made negative contributions.
Viewing the CFNAI data alongside the Conference Board’s Leading Economic Index (LEI) creates an optimistic mixture. Our economy is currently reaching some of the best levels of the current expansion according to the CFNAI. Additionally, the LEI is improving, suggesting further growth is on the horizon. It is unknowable how long the current expansion will last, however, for now, it appears to be in good condition with more of the same expected in the near-term future.
