
  877.543.5970 ext. 102   christopher@atlasindicators.com
  •  
  •   Client Login

  • Home
  • About 
    • Our Team
    • Our Philosophy
    • Our Process
  • Our Services 
    • Our Services
    • Investments
    • Insurance
    • Retirement Planning
  • Resources 
    • Useful Websites
    • Financial Calculators
    • Video Library
  • Blog
  • Contact

    You are here

  1. Home
  2. Blogs
  3. June 2018 Income and Outlays

June 2018 Income and Outlays

Submitted by Atlas Indicators Investment Advisors on August 16th, 2018


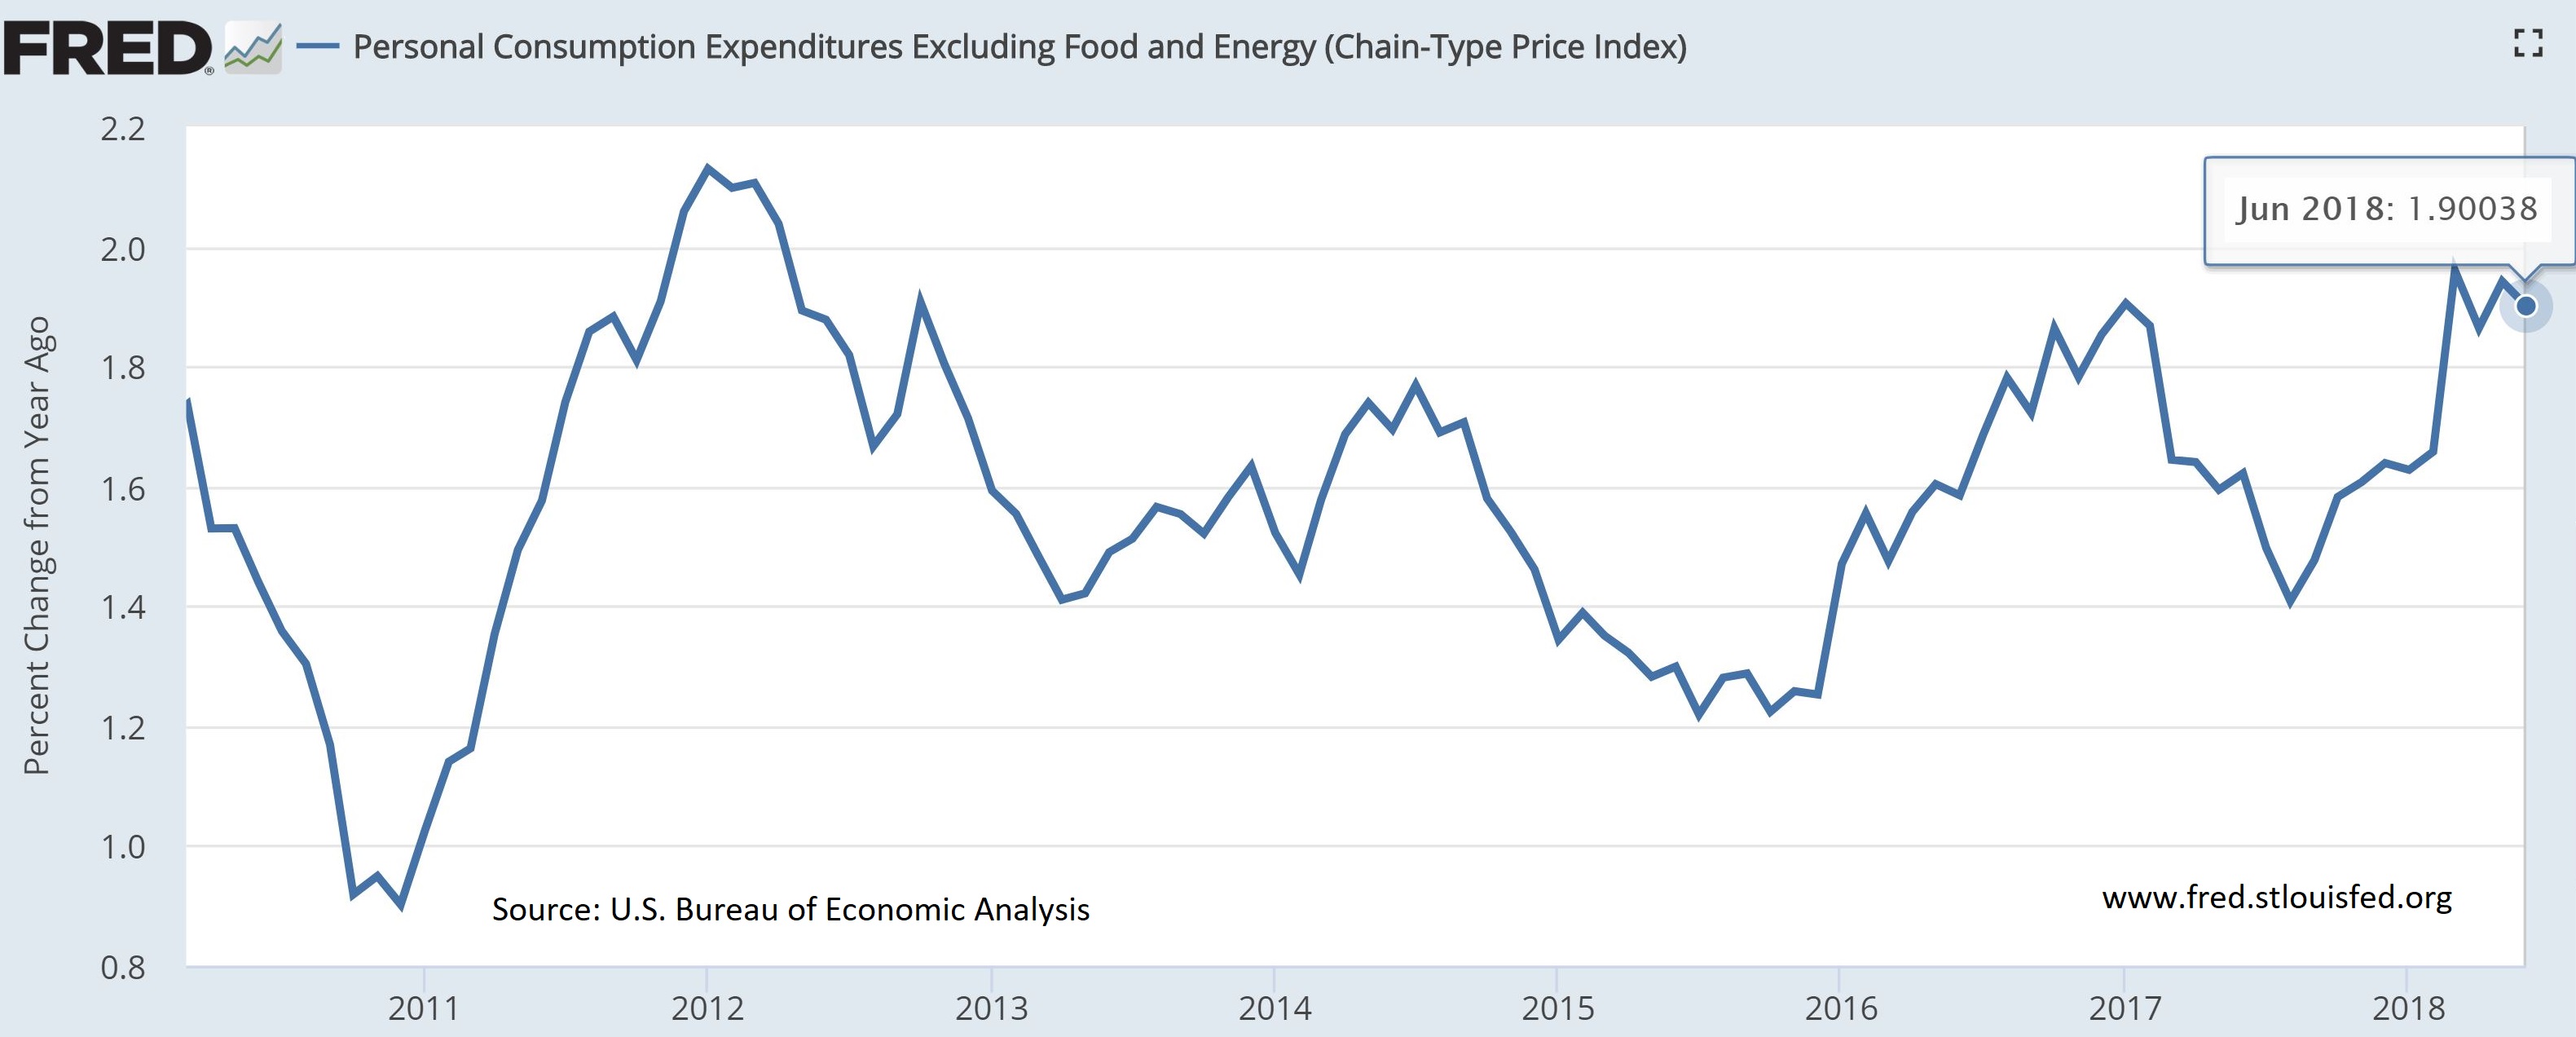
Americans made and spent more money in June 2018 than in the prior period according to the Bureau of Economic Analysis.  Their release on income and outlays show pay rose 0.4 percent to end the second quarter and has grown 4.9 percent in the past 12 months.  Outlay data added to the good news.  Consumers spent 0.4 percent more than a month earlier, and both May and April were upwardly revised.  May outlays were up 0.5 percent (originally 0.2 percent) and April surged 0.6 percent (originally 0.5 percent).


Personal income rose $71.1 billion in the period as all four major categories in pay rose.  Wages and salaries increased 0.4 percent or $31 billion.  Proprietors took in an additional $7.4 billion or 0.5 percent.  Rental income was $4.5 billion higher, an increase of 0.6 percent.  Lastly, personal receipts on assets (interest and dividend payments) tacked on an additional $19.6 billion or 0.7 percent.  After-tax pay rose $65.3 billion or 0.4 percent; categorized as disposable income, it can either be spent or saved. 


As is normally the case, most of the increase in disposable income was spent.  Personal consumption expenditures (PCE) were mixed however.  Spending on durable goods rose marginally while purchases of nondurable goods declined 0.1 percent.  Fortunately, consumption of services jumped 0.6 percent in the period. Unfortunately, interest payments are another item on which Americans are spending more.  This line item (measuring interest paid on nonmortgage debts) has been trending higher and is now 6.7 percent greater than as recently as January.


Disposable income not spent on goods, services, or debt makes up personal savings.  After hitting a recent peak of 7.4 percent in February of this year, it has been trending lower and is currently at 6.8 percent.


Also presented in this report are data on inflation, including the Federal Reserve’s preferred price proxy.  Headline inflation inched up 0.1 percent in June, while the year-over-year tally held steady at 2.2 percent.  Looking at the core-PCE price index (which removes food and energy), it also edged up 0.1 percent in the period and matched the previous year-over-year print of 1.9 percent.  It remains near the central bank’s explicit target of 2.0 percent. 


All told, this is a strong report for income and outlays.  Incomes are rising, and spending is moving ahead as well.  Consumers are our economy’s primary driver, and as this release demonstrates, they are continuing to improve in aggregate.  Simultaneously, the Federal Reserve is getting closer to their inflation trend target.  They have noted a willingness to let inflation overshoot their goal, so it seems unlikely that they will make drastic changes to their monetary policy’s trajectory, opting instead to allow the economy to keep pushing ahead while remaining measured in their tightening.  Currently, Atlas expects another quarter point upward bump in the Federal Funds rate toward the end of September.

Tags:
  • PCE
  • PCE Price Index

Book a Meeting

Tell a Friend

Looking to learn more?

Get in touch today

Contact Us

Additional info

  • Sitemap
  • Legal, privacy, copyright and trademark information

Contact info

  •   560 W Foothill Pkwy, Corona, CA 92882
  •   877.543.5970 ext. 102
  •   christopher@atlasindicators.com

Investment Advisory Services offered through Independent Advisor Representatives of Cooper McManus, a Registered Investment Adviser Securities offered through Registered Representatives of Cambridge Investment Research, Inc., a broker-dealer, member FINRA/SIPC, to residents of: CA, HI, MA, MT, OR, PA, and TX. Cambridge and Atlas Indicators Investment Advisors, Inc. are not affiliated.​

Cambridge's Form CRS (Client Relationship Summary)

Please see the following for our services disclaimer: Asset Allocation: Diversification seeks to reduce the volatility of a portfolio by investing in a variety of asset classes. Neither asset allocation nor diversification guarantee against market loss or greater or more consistent returns. Asset allocation does not guarantee a profit or protection from losses in a declining market. Precious Metals: Investments in precious metals such as gold involve risk. Investments in precious metals are not suitable to everyone and may involve loss of your entire investment. These investments are subject to sudden price fluctuation, possible insolvency of the trading exchange and potential losses of more than your original investment when using leverage. Real Estate: Specific-sector investing such as real estate can be subject to different and greater risks than more diversified investments. Declines in the value of real estate, economic conditions, property taxes, tax laws, and interest rates all present potential risks to real estate investments. Diversification: Diversification seeks to reduce the volatility of a portfolio by investing in a variety of asset classes. Neither asset allocation nor diversification guarantee against market loss or greater or more consistent returns. Index: An investor cannot invest directly in an index.

This site is published for residents of the United States and is for informational purposes only and does not constitute an offer to sell or a solicitation of an offer to buy any security or product that may be referenced herein. Persons mentioned on this website may only offer services and transact business and/or respond to inquiries in states or jurisdictions in which they have been properly registered or are exempt from registration. Not all products and services referenced on this site are available in every state, jurisdiction or from every person listed.

© 2025 Atlas Indicators Investment Advisors. All rights reserved.

Website Design For Financial Services Professionals