![]()
August 2018 Producer Price Index
Submitted by Atlas Indicators Investment Advisors on October 1st, 2018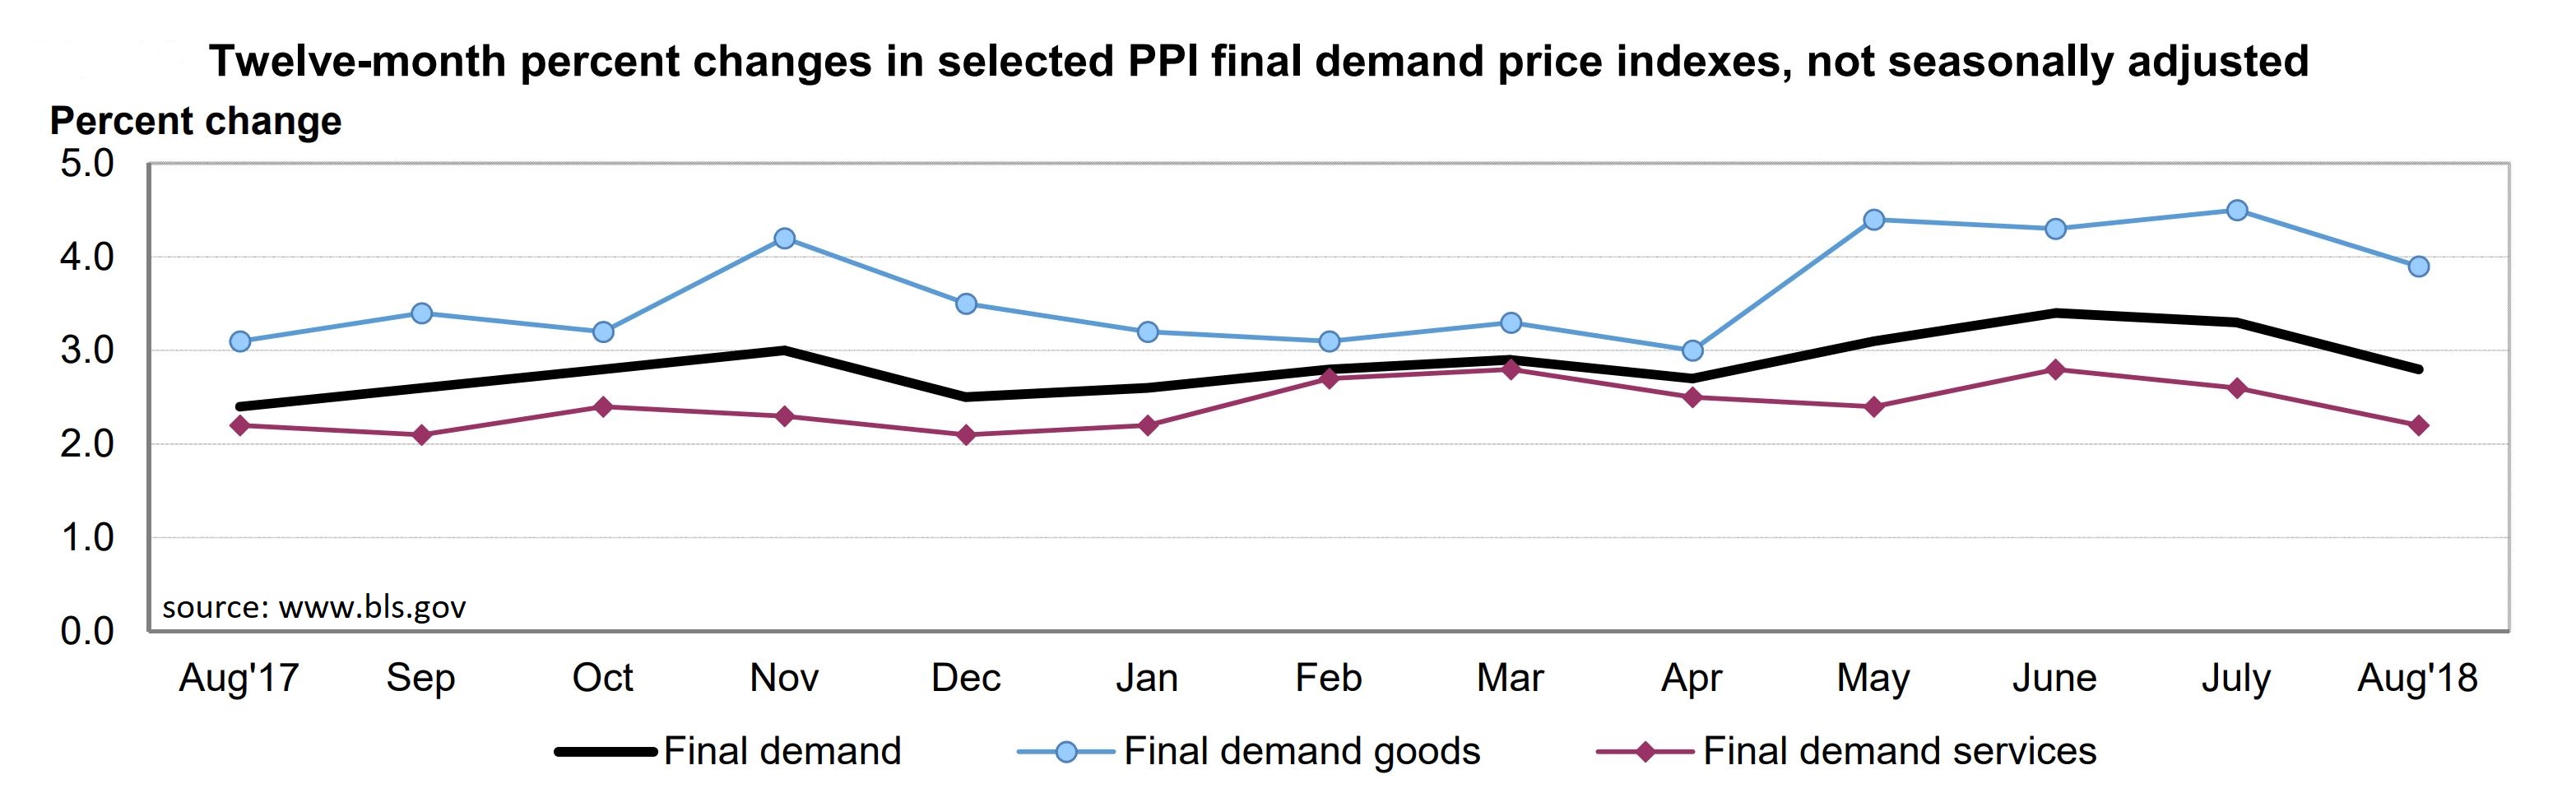
Prices paid by producers and wholesalers fell in August 2018 according to the Bureau of Labor Statistics’ Producer Price Index (PPI). Measuring costs associated with firms’ final demand, PPI dropped 0.1 percent after holding steady in July. The service portion of the economy, which fell by 0.1 percent, primarily influenced the most recent decline. The index for final demand goods held steady in the period. Year-over-year, headline PPI is up 2.8 percent, contracting 0.5 percent compared to the prior month.
Earlier stage data were mixed. Processed goods for intermediate demand were unchanged for a second consecutive month. In August, a 0.2 percent increase for processed materials offset a 0.8 percent reduction for processed foods and feeds as well as a 0.3 percent drop for processed energy. Over the past twelve months, prices for this portion of PPI has increased 6.8 percent. Unprocessed goods for intermediate demand fell off a cliff in the middle of the summer, plummeting 5.8 percent in August (the largest monthly slump since falling 9.7 percent in January 2015). Over half of this plunge is attributed to a steep drop for crude petroleum, which declined 13.4 percent. However, other categories were weaker as well; these include slaughtered poultry, barrows and gilts, raw milk, iron and steel scraps, and grapes. Nevertheless, intermediate services managed an uptick of 0.1 percent which followed a 0.2 percent climb in July.
Inflation remains a mystery. As you can see in the graph above, price growth is decelerating in the indicator. The year-over-year rate of change reached a near-term peak in June and has fallen twice since then. However, wage data in last month’s employment report was higher. Go figure. Currently, inflation appears to be more of a labor issue. Only time will tell if rising employee costs percolate into other measures of price on a sustained basis.
